


Range, Standard Deviation & Variance
Variability shows how much an item is different from other items. In regards to statistics, variability illustrates how individual values are different from each other within a set of values. The following data sets were created to demonstrate variability and are not real accurate data sets.
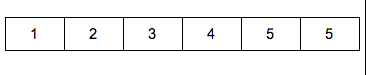
Data Set 1 contains the following values: 1, 2, 3, 4, 5 , 6. This data set is the most variable because no two values are the same.
Data Set 2 contains the following values: 1, 2, 3, 4, 5, 5. This data set demonstrates some variability because only two values are the same and the remaining values are different from each other.
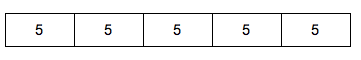
Data set 3 contains the following values: 5, 5, 5, 5, 5. This data set has no variability because the values do not differ from each other. The values are all the same, in this case they are all 5.
Understanding variability was essential to explain the three culprits of variability: Range, Standard Deviation, and Variance.
The range of a set of data is the difference between the highest and lowest values in the set.
Standard deviation illustrates how far away from the mean (of the data set) a value is within a data set.
Variance is another way for statistics to demonstrate variability and it is simply the standard deviation squared.

The following data sets were created to provide support to explain the fictional educational scenarios used to calculate the range, standard deviation, and variance using these fictional values.
Data set 1 was designed to illustrate most variable data because no two values are identical:

Data set 2 was designed to illustrate some variable data because only two values are the same and the remaining values are different from each other.
Data set 3 was created to show no variability because all the values are the same.
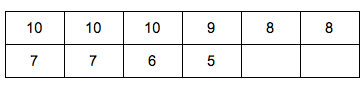
Data set 4 was created to demonstrate how to calculate range, standard deviation, and variance. These values represent minutes students use in a forensic science classroom either preparing to begin their lab class period or the time it takes students to prepare all pre-lab activities.


Range
The first measure of variability, which is the most general, that will be discussed is the range (r). The range of a set of data is the difference between the highest and lowest values in the set. (Salkind, 2017).
When would knowing the range be helpful in education? If a teacher wants to know what the range of time it will take her forensic science students to prepare to conduct a lab in her classroom. The tasks the students must complete in order to be ready for lab are handing in their homework, placing their belongings at their desk before they are ready to start preparing for lab. Knowing how long this process will take is beneficial because the teacher can then plan how much time is left in a class period to actually prepare for, conduct, and cleanup a lab conducted by her students.
The following data, minutes it takes students to prepare for lab, and names were created and do not really exist in order to explain how to calculate the range. The following minutes is the time it takes students to prepare for lab in Mrs. Smith’s class: 10, 10, 10, 9, 8, 8, 7, 7, 6, and 5. In order to compute the range a simple equation is utilized, subtract the lowest value from the highest value in the data set.
Data Set: Minutes for students to prepare for lab in Mrs. Smith’s class
10, 10, 10, 9, 8, 8, 7, 7, 6, 5
r = 10.00 - 5.00
r = 5.00
The range is 5.00 minutes.
In this case the teacher, Mrs. Smith, knows she needs to allocate at least 5.00 minutes of class time for students’ initial responsibilities of arriving in her classroom to prepare for lab.
Standard Deviation
The second measure of variability, which is also the most frequently used, is the standard deviation (s or SD). The standard deviation provides what the average distance of a value in a data set is from the mean of that same data set. Therefore, it is used to estimate something about a population. Since the standard deviation allows you to look at a data from a particular sample and then apply that result to an entire population it must be calculated without biased (Salkind, 2017). The example created to demonstrate how to calculate the standard deviation provided will be an unbiased standard deviation, therefore the results of the sample could be used to discuss the population if either of these really existed.
In addition to understanding standard deviation in relation to variability it is important to know that the larger the standard deviation is the larger the distance of each value from the mean of that data set which indicates more variability. In fact, the larger your sample the less difference there will be between a biased (standard deviation of the sample) and an unbiased standard deviation (standard deviation of the population) (Salkind, 2017).
The following values are made up in order to illustrate how to calculate the standard deviation and how it could be used in an education setting. We will pretend that the values represent the minutes it takes forensic science students to settle into their lab groups at their lab tables ready to start lab which includes obtaining their gloves and goggles, reading their pre-lab, and obtaining the rest of their laboratory supplies needed as indicated in the prelab.
Data Set: Minutes for forensic science students to settle into their lab groups
10, 10, 10, 9, 8, 8, 7, 7, 6, 5
The following six steps are used to calculate the standard deviation:
1. Calculate the average:
10.00 + 10.00 + 10.00 + 9.00 + 8.00 + 8.00 +
7.00 + 7.00 + 6.00 + 5.00 = 80.0
80.0/10.00 = 8.00
It takes about 8.00 minutes for forensic science students in this class to enter the classroom, read their prelab and gather all their lab supplies.
2. Subtract the average, which was calculated in step 1, from each value in the data set:
10.00 - 8.00 = 2.00
10.00 - 8.00 = 2.00
10.00 - 8.00 = 2.00
9.00 - 8.00 = 1.00
8.00 - 8.00 = 0.00
8.00 - 8.00 = 0.00
7.00 - 8.00 = -1.00
7.00 - 8.00 = -1.00
6.00 - 8.00 = -2.00
5.00 - 8.00 = -3.00
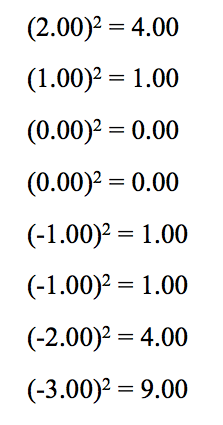
3. Square each result from step 2:
4. Add all the squared results, from step 3, together
4.00 + 4.00 + 4.00 + 1.00 + 0.00 + 0.00 +
1.00 + 1.00 + 4.00 + 9.00 = 28.0
5. Divide the sum, which was calculated in step 4, by one less the total number of values in the data set, which is 9.00 (10.00 - 1.00).
28.0/9.00 = 3.11
6. Take the square root of the result of step 5:
√(3.11) = 1.76
Since the calculated standard deviation for this example does not equal zero it means that there exists some variation in the values of the data set. However, If the standard deviation calculated resulted to zero this would be a clear indication that the data set had no variation and the values would be all identical (Salkind, 2017).
A special consideration must be made if a data set contained outliers when calculating the standard deviation. An outlier is a value in the data set that is extreme in comparison to all the other values in the data set. If an outlier was present in a data set it must be reported as being present because the standard deviation is sensitive to outliers just the same as means are (Salkind, 2017). SInce calculating the mean is a part of the steps to calculating the standard deviation it can clearly be understood why the standard deviation is sensitive to outliers. . Therefore, since the standard deviation is a part of descriptive statistics it is important to describe your data set, especially if outliers are present!
The following is another fiction educational data set created to provide an example of an outlier. A student ran into a classmate who was upset in the hallway. After inquiring what was wrong and escorting that classmate to guidance, this student came into class late. Being still concerned for their friend, the student took longer to focus on the prelab reading and was not ready to start lab until 35 minutes passed. This value is much different than the ten other values in the data set (35, 10, 10, 10, 9, 8, 8, 7, 7, 6, 5) and therefore it is considered an outlier. If a range was now calculated with this outlier it would be 30.0 as opposed to the original 5.00. If we were to include the outlier of 35, the standard deviation of the data set would be larger.
Variance
The third and last measure of variability that will be discussed is variance. Variance is easy to calculate and it is often used in other statistical calculations and not used very often on its own. The formula for calculating variance is to square the standard deviation. Using the previous calculated standard deviation, 1.76, determining the variance is quite simple 1.762 equals 3.10. If we were to include the outlier of 35, the variance of the data set would be larger.