


Analysis of Variance, or ANOVA, is a statistical process to compare the means of variables. ANOVA is a simple test for the difference between means for a single independent variable (Salkind, 2017).

I created this fictional data set to demonstrate a one-way ANOVA test. Students were enrolled in one of three afterschool programs to prepare them for the PARCC test. The first program ran for three month, the second ran for six months, and the last one ran for nine months. The table above displays the PARCC scores for the three groups after the treatment.
In this scenario the District wants to evaluate the effects of the length of the program.
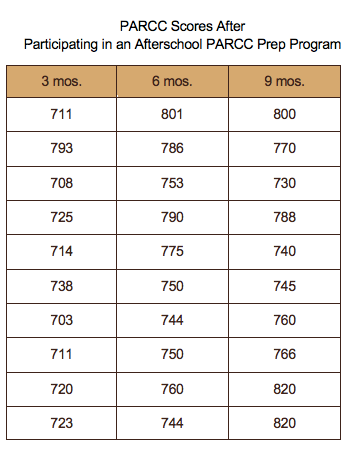


The school administrators wanted to determine if the length of an after school program affected PARCC results. They randomly assigned students to three treatment groups: one for three months, another that lasted six months and the last one lasting for nine months.
The Ho: μ3 mos.=μ6 mos.=μ9 mos. and Ha: μ3 mos. ≠ μ6 mos.≠ μ9 mos. were established and the alpha level was set as α = 0.05 Using SPSS statistical software descriptive statistics were calculated. The results were as follows: μ3 mos.=724.60, μ6 mos.=765.30, and μ9 mos.=754.60. A one-way ANOVA was conducted to determine if the differences in means represent normal random variance or if the difference was statistically significant. The following table summarizes the findings:
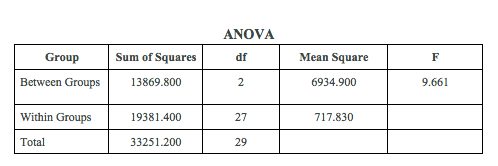
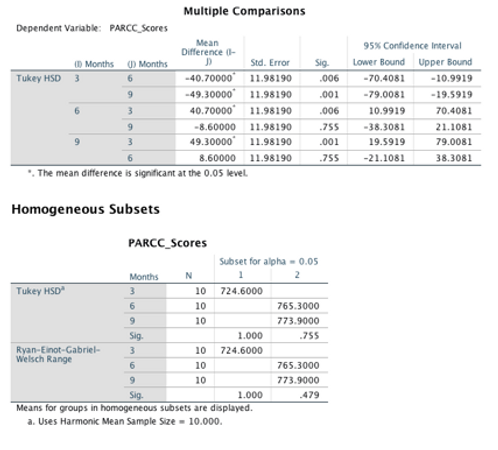
With an F score of 9.661 it was determined that the null hypothesis should be rejected at the .05 alpha level. Based on this finding, it was established that a statistically significant difference existed between the groups. To determine where the difference lies, a Tukey HSD, Ad Hoc test was conducted.